Course Reflection
The image below depicts components of big data and analytics within manufacturing. (Matellio, 2024)

Based on the metrics
below from the Matellio website, we can see that 91.9% of companies are getting
value out of the analytics that have been collected in manufacturing (I would
be very curious to know what the percentages for other industries are, if you
have this information, please send it my way)

In my opinion,
understanding of how to benefit from big data and analytics breaks down when we
start to discuss 2D processes that run within an organization. For example,
typical workstreams that run in SAP are:
- Record-to-Report
(R2R)
- Procure-to-Pay
(P2P)
- Order-to-Cash
(OTC)
We
do not seem to treat 2D processes that run within an organization for what they
are, which is essentially processes that “assemble” an output. In essence,
these processes are a manufacturing processes without a physical output. I
think because, we cannot visually see the process execute in a dynamic way in
front of our eyes this hurts our perception of what we can do with big data and
analytics. Making it harder to sell the possibilities and benefit that big data
and analytics can provide. I work in the P2P functional area and here is an
example of a basic P2P process and how it might look if we were to view it as a
manufacturing assembly line.

Just
by adding the context of the 4 walls to the process it makes it easier to
visualize the process in a way that makes sense for business partners to
interpret and in a way that we can look for optimization opportunities.
Now, the question
becomes “Why is it important to view a process within this paradigm”. The reason
it is important to view a process within this paradigm, is it helps us to
understand that we are running a repeatable process that can be measured and
quantified. So what if we replicate this process not for just 1 P2P “plants”
but for multiple P2P plants within a network. What would that look like?

We can see that we
are running 1 repeatable process in multiple areas (North America Europe, Asia
etc.) in which a company operates. The procedures within the P2P plants start to
look like a standard network of processes that can be optimized and will -
- Produce a
large amount of data
- Allow us to
isolate and identify process improvement opportunities
This will lead us to discussion of multiple
points
- What KPIs
can we establish to baseline the existing effectiveness of the process?
- We need to
have a baseline to base process improvement opportunities against
- At which
points of the process should KPIs be established? What KPIs should be set
for the overall process?
For example, let’s
assume that we have 3 different types of machines within the assembly process
of a manufacturing facility, each of those machines would have a different KPI.
We would not just set a KPI for the throughput of the manufacturing assembly
line.

Here is the same paradigm for the P2P process
but, instead of machines we have process steps:

From the course material, I really like the idea of using a well defined process or framework for establishing KPIs that we see with the balanced scorecard approach. In my experience, KPIs when a system is involved in executing the process are almost always focused on the levels of automation. Not even considering if the process that is being executed actually makes sense. Basically, we automate a lot of bad processes and do not focus on the financial, customer and learning and growth areas when KPIs are established. I think the balanced scorecard approach could help with that.
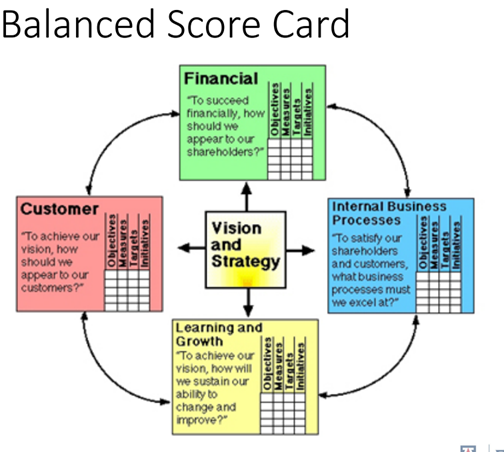
(Ram,
n.d.)
- How can we
leverage business intelligence for the data that we are collecting?
This is the step
where I think we are not getting enough value out of big data for 2-D processes
that are running within an organization. Because, we are not able to set the
correct paradigm in our business partners minds about the processes that they
are running to give them the context of 1) what type of data is important to
analyze and 2) at which point in the process
If we can identify
the steps within the process that are important to measure, we can select the
right tool and technique to capture the data. By capturing the data we can
begin to report against the initial KPIs that we have established using the
balanced scorecard approach to look for opportunities for improvement. This would
allow us to use “business intelligence applications, tools, technologies and
techniques used for gathering, storing, and analyzing data to provide
actionable insights that will help organizations make valuable business
decisions, to measure and manage their performance, and to continuously innovate.”
(Ram, n.d.)
The key point here is
NOT all the tools, technologies and techniques we apply within the process are
going to be the same. We may have to use multiple business analysis tools and
techniques to be able to capture, store and report the data that is being
collected throughout the process.
For some reason, in
IT we always want to have “1 tool” or "1 technique” to use for business
intelligence and I don’t think that makes sense. Because, if you draw the
parallel to manufacturing where you can see the 3D process, it is very clear
that you cannot use the same technique to capture all the data that you need
across the assembly line. But we tend to put the “1 tool” or “1 technique”
limitation on business intelligence when it comes to 2D processes like P2P
- Based on the
data that we are collecting, how can we replace manual processes (or
labor) in the process with automation?
As
I mentioned earlier it is important to create KPIs that focus on more than just
automation. But, for those KPIs that are established across the 2-D process
with automation targets, we need to try and challenge ourselves to think about
if we have a manual step in this process. How can we leverage Artificial Intelligence
/ Automation to optimize a procedure?
Now going back to our
manufacturing example with the establishment of KPIs throughout the process we
can begin to look for automation opportunities. But, just like business
intelligence tools and techniques not all automation and AI approaches will be the
same. We might have to implement different approaches: basic automation,
robotics process automation, enhanced process automation, algorithmic
automation or artificial intelligence. Below is a table the summarizes the
differences and features within each automation type.

(Intelligence Automation, n.d.)
To determine the best automation type, we have
many influencing factors that determine the best fit “automation” capability for
each task type
●
Product Maturity Offer
●
Operational Mode (Structured /
Semi-Structured / Unstructured )
●
Business Case Scope (Focused /
Wide)
●
Disruption in Job Definition
●
Cost to implement and maintain
●
Time to implement
●
Return on Investment
(The 3
Ways Work Can Be Automated, n.d.)
This is the same as manufacturing, the “robot” that I need to spray paint on the door of a car in the manufacturing process is different from the “robot” that I need to stamp the hood from sheet metal

Spray Painting Car
(Source: https://global.toyota/en/company/plant-tours/painting/#sec03)

Stamp
Hood
(Source:
Truck Hood Stamping and Laser Cutting - QMC-EMI)
So what is the point that I am trying to make and how it this related to the course?
The point that I am trying to make is that, we can do a lot more with big data and analytics in other areas of an organization outside of the manufacturing process. But the manufacturing process seems to me to be the most mature area that is using big data and analytics frequently (maybe outside of financial services, I do not have experience working in the financial services sector but, I assume big data and analytics is used often for fraud monitoring and detection). But, if we cannot set the right paradigm in the minds of our business partners, it is difficult for our business partners to connect the dots for how big data and analytics applies to their 2D process. Even more complicated is how to use business intelligence within the process (where? And why?) and pushing further than THAT how can we create value using Intelligent Automation / Artificial Intelligence.
This course really helped me to get more insights into the business intelligence domain and its piece of the overall puzzle. But, I wanted to write this blog entry to try to explain that if we can set the correct paradigm in our business partners minds about how to understand how big data and analytics can help them improve their processes, then I think we will be able to (1) work in a very collaborative way and (2) create more value for the organizations that we work in. If not, we will continue to collect data for the sake of collecting data with no real understanding of the gold mines that we are sitting on top off. In the end, the bottom line for most companies is how can we create value for the shareholders that we serve and that technology is a supporting and enabling tool to help execute that objective. So setting the correct context or paradigm for our business partners is extremely important to get the value that is being presented by big data and analytics.
I know that this is the end of the course, but
if anyone happens to read this blog. I would be interested to hear your feedback.
References
Intelligence Automation. (n.d.). From CGI:
https://www.cgi.com/belgium/en/intelligent-automation
matellio. (2024, July 26). From
https://www.matellio.com/blog/big-data-analytics-in-manufacturing/
Ram, S. (n.d.). Introduction to Balanced
Scorecard. From University of Arizona:
https://d2l.arizona.edu/content/enforced/1481664-924-2244-7BMIS587206/O-MIS-587-Lecture-4.pdf
Ram, S. (n.d.). Introduction to Business
Intelligence. From University of Arizona:
https://d2l.arizona.edu/content/enforced/1481664-924-2244-7BMIS587206/O-MIS-587-Lecture-2.pdf
The 3 ways work can be automated. (n.d.). From Harvard Business Review:
https://hbr.org/2016/10/the-3-ways-work-can-be-automated

Comments
Post a Comment